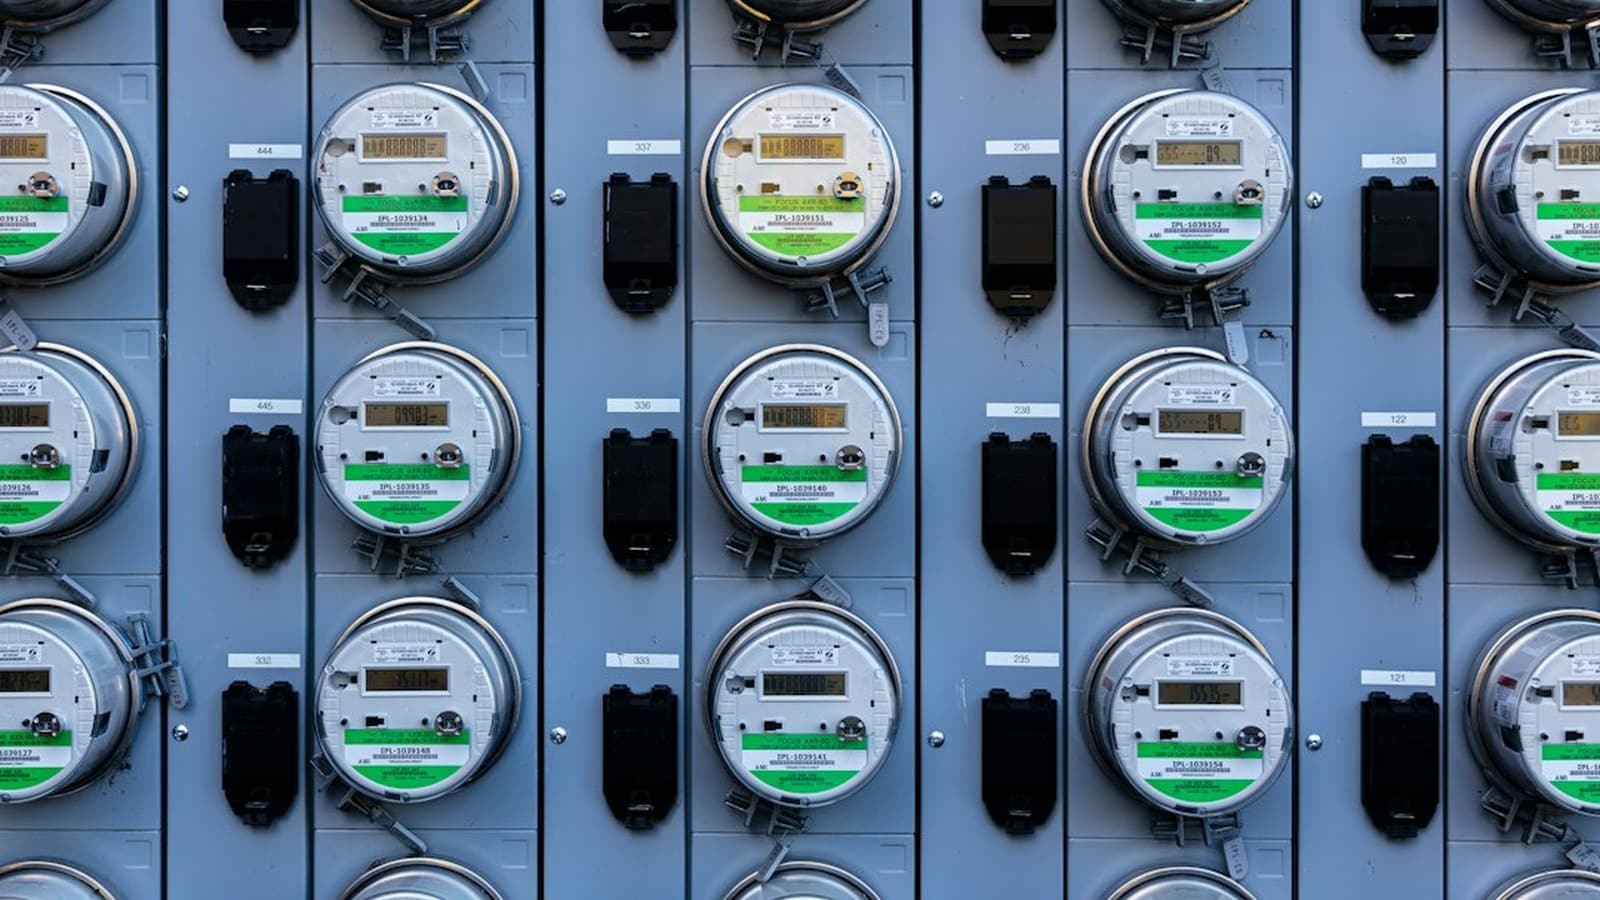
Smart Meter Texas is the website where Texas delivery utilities post the readings from your home's smart meter. Register with your ESI ID, meter number and electricity provider, download up to two years of usage, then price each plan's Electricity Facts Label (EFL) at your own month-by-month kWh instead of the 1,000 kWh example.
That last step is where most shoppers stop. An EFL's average price is calculated at exactly 500, 1,000 and 2,000 kWh, and few homes use exactly 1,000 kWh in a given month. In the worked example below, a bill credit plan whose label looks 4.5 cents cheaper per kWh at 1,000 kWh costs $91.45 more over a year of an example home's usage.
Smart Meter Texas (SMT) is a secure website, smartmetertexas.com, that stores the electricity readings from advanced meters in the competitive areas of Texas. The delivery utilities that own the meters post the data: AEP Texas Central, AEP Texas North, CenterPoint Energy Houston Electric, Oncor Electric Delivery and Texas-New Mexico Power (TNMP), according to the SMT Data Access Interface Guide.
Your electricity provider sends the bill, but your delivery utility reads the meter. That's why Smart Meter Texas works the same way whichever provider you choose. The portal offers three kinds of reports, which the SMT residential user guide lists as "Energy Data 15 Min Interval, Daily Meter Reads, and Monthly Billing Information."
The 15-minute readings come from a Public Utility Commission of Texas (PUCT) rule. The PUCT's advanced metering rule requires utilities to provide "15-minute or shorter interval data" to providers and customers on a daily basis, available no later than the day after it was recorded. That works out to 96 readings for every day your meter runs.
Not sure your home has a smart meter? Ambit Energy's FAQ for new customers says that if a digital meter was installed at your home since January 2009, "it's most likely a Smart Meter."
You need five pieces of information to open a residential Smart Meter Texas account: your first and last name, an email address, your full ESI ID, your meter number and the name of your retail electric provider (REP). The SMT residential user guide lists the ESI ID, meter number and REP as the required "Security Information."
If Smart Meter Texas doesn't accept your numbers, compare them with your most recent bill, or ask your provider to confirm them.
Smart Meter Texas lets you view and export up to two years of usage. Log in, open the energy data report, choose the report type and date range, and export the result as a CSV file you can open in any spreadsheet. For pricing plans, the monthly report is the one you need.
The current SMT residential user guide says the dashboard can "view up to two years of your energy usage data," and the same two years are available for export. Some older guides online still say 13 months, which was the limit of an earlier SMT export format.
Pick the report that matches the question you're asking:
| Smart Meter Texas report | What it shows | Use it to |
|---|---|---|
| Monthly Billing Information | kWh for each billing period | Price fixed-rate and bill credit plans month by month |
| Daily Meter Reads | One meter reading per day | Spot cold snaps, heat waves and unusual days |
| Energy Data 15 Min Interval | 96 readings per day | Price free nights, free weekends and other time-of-use plans |
Pull at least your last 12 complete months so every season is in the file. If you have 24 months, keep both years. A mild winter next to a hard one shows the range your bills can cover. If you're weighing a time-of-use plan, the free nights plan calculator walks through the 15-minute math.

The 1,000 kWh price on an Electricity Facts Label is an average at one exact usage level. Texas rules require every EFL to show the average price at 500, 1,000 and 2,000 kWh, but your bill depends on where your real usage lands each month. Bill credits, base charges and usage tiers can make a plan cheap at 1,000 kWh and expensive at 940.
Texas homes rarely sit at one number. The EIA's 2024 residential bill data puts the average Texas home at 1,096 kWh a month and an average price of 14.94 cents per kWh (as of October 7, 2025, the most recent edition of that EIA table), for an average bill of $163.72 across 12,547,863 residential customers. That average blends summer peaks with spring and fall lows.
The PUCT's Electricity Facts Label rule, 16 TAC §25.475, sets those three usage levels. Three EFL features react most to your real kWh:
The guide to reading a Texas Electricity Facts Label covers each line, and the explainer on how Texas bill credit plans work shows when a credit disappears.
To price a plan at your real usage, build each month's bill from the EFL and add delivery: the base charge, plus the energy charge times your kWh, plus the TDU's monthly charge, plus the TDU's per-kWh charge times your kWh, minus any bill credit that month's kWh qualifies for. Then add the 12 months together.
Monthly cost = base charge + (energy charge × kWh) + TDU monthly charge + (TDU per-kWh charge × kWh), minus any bill credit you qualify for
Some EFLs list TDU delivery charges on their own lines, and others fold them into one price per kWh. Either way, delivery charges are the same for every provider in your area. These are the residential delivery charges on the PUCT's table as of November 1, 2026:
| Delivery utility | Monthly charge | Per-kWh charge | Delivery at 1,000 kWh |
|---|---|---|---|
| Oncor | $4.06 | 6.8673 cents | $72.73 |
| CenterPoint | $4.90 | 6.5333 cents | $70.23 |
| AEP Texas Central | $3.24 | about 5.7 cents | $60.15 |
| AEP Texas North | $3.24 | about 5.6 cents | $59.00 |
| TNMP | $7.56 | 7.7710 cents | $85.27 |
Source: PUCT residential TDU delivery charges, as of November 1, 2026, read November 3, 2026. The PUCT rounds the AEP per-kWh charges, so multiplying them won't reproduce the AEP totals exactly.
The guide to TDU delivery charges for Oncor, CenterPoint, AEP and TNMP explains how these lines appear on a bill. The examples below leave out taxes and small regulatory fees, which vary by city.
The 12-3-1 Usage Check is a three-part test for any plan you're considering, built from your Smart Meter Texas download. Price all 12 months of your real usage, preview your next bills with last winter's 3 months, and stress-test the plan against your 1 lowest month. A plan that holds up in all three fits your home.

Here's the 12-3-1 Usage Check for an example home in Oncor territory that used 14,390 kWh over 12 months, about 1,199 kWh a month on average. It compares two hypothetical plans built only to show the math. They aren't real offers, and the usage profile is illustrative. Delivery uses Oncor's charges as of November 1, 2026.
On the label, Plan B looks 4.5 cents cheaper per kWh at 1,000 kWh. Here's what each plan would cost at this home's usage, at Oncor's delivery charges as of November 1, 2026:
| Month | Usage (kWh) | Plan A | Plan B | Credit applied? |
|---|---|---|---|---|
| Nov 2025 | 780 | $123.92 | $166.82 | No |
| Dec 2025 | 1,240 | $194.61 | $162.81 | Yes |
| Jan 2026 | 1,350 | $211.52 | $185.77 | Yes |
| Feb 2026 | 1,180 | $185.39 | $150.29 | Yes |
| Mar 2026 | 820 | $130.07 | $175.17 | No |
| Apr 2026 | 760 | $120.85 | $162.65 | No |
| May 2026 | 980 | $154.66 | $208.56 | No |
| Jun 2026 | 1,420 | $222.28 | $200.38 | Yes |
| Jul 2026 | 1,690 | $263.77 | $256.72 | Yes |
| Aug 2026 | 1,780 | $277.60 | $275.50 | Yes |
| Sep 2026 | 1,450 | $226.89 | $206.64 | Yes |
| Oct 2026 | 940 | $148.51 | $200.21 | No |
| 12 months | 14,390 | $2,260.07 | $2,351.52 | 7 of 12 |
What the three checks show:
There's a second edge. Plan B only beats Plan A in months between 1,000 and about 1,818 kWh. Below 1,000 it loses the credit, and above about 1,818 kWh its higher energy charge outweighs the $100. August, at 1,780 kWh, saved just $2.10.
None of this makes bill credit plans bad. A home that stays between those two lines most months could come out ahead on Plan B. Only your own usage file can tell you which kind of home you have.
Last December to February is your winter preview because a plan you sign this fall bills those months first, and winter usage behaves differently from summer usage. Homes with electric heat can jump sharply on cold days, so last winter's kWh is a better guide to your next three bills than your 12-month average.
Electric heat is common in Texas. Researchers Blake Shaffer and Daniel Quintero of the University of Calgary and Joshua Rhodes of the University of Texas at Austin noted that the share of Texas households using electric heat rose from 52% to 61% over about 15 years, citing U.S. Census Bureau data. Their 2022 study in iScience concluded that "Texas's increased sensitivity to cold weather extremes is not limited to the supply side, but the demand side as well."
The type of heat matters. ACEEE's 2024 Texas analysis estimated that over 25% of Texas households, 2.76 million homes in 2020, pair central air conditioning with an electric resistance furnace. When temperatures drop, those systems average about 9 kW of demand per home, according to the American Council for an Energy-Efficient Economy.
A separate analysis by Matthew Skiles, Joshua Rhodes and Michael Webber of UT Austin found that ERCOT's winter peak has grown far less steadily than its summer peak. The authors called that pattern "likely a consequence of high residential electrical heating load on winter peak demand days."

The grid shows the same thing. ERCOT set its all-time winter demand record of 80,560 MW on February 20, 2025, topping the 78,349 MW record from January 16, 2024, according to ERCOT's peak demand records. Last winter's monthly peaks were 63,131 MW in December 2025, 75,572 MW in January 2026 and 69,612 MW in February 2026, according to ERCOT's monthly operational overviews. The ERCOT December 2026 winter outlook covers what a winter storm can and can't do to your bill.
To build your own winter preview:
Ambit Energy customers get two more views of the same meter data. Ambit's Weekly Usage Report is a short, regular summary of your usage, and your MyAmbit account holds your usage history. Smart Meter Texas is still the place to download a full file for pricing a new plan.
Ambit describes its Weekly Usage Reports as "quick rundowns that show when you use the most electricity and how the weather impacts your usage," with tips "to help you save no matter what the seasons bring." That weather link is what a winter preview needs. A cold week that shows up as a spike in the report is a week to find in your Smart Meter Texas daily data.
For a look back, Ambit's FAQ on viewing usage history says to "Visit your MyAmbit Account for all your usage history information."
Each tool has its own job:
Most pricing errors come from using too little data or dropping delivery charges. A comparison is only as good as the months it covers and the charges it includes.
If your contract ends soon, the guide to the best time to renew an electricity contract in Texas explains how to plan the switch date.
Signing up doesn't ask for any payment details. The residential form asks for your name, email address, ESI ID, meter number and provider. The data itself belongs to you: Texas law, PURA §39.107, says meter data from advanced meters "shall belong to a customer."
Smart Meter Texas keeps up to two years of usage in 15-minute, daily and monthly form, according to the current SMT residential user guide. Your account may show less if your meter is newer than that.
PUCT rules require 15-minute data to be available no later than the day after it was recorded, so yesterday's usage should appear today.
Download Monthly Billing Information to price fixed-rate and bill credit plans. Add the Energy Data 15 Min Interval report if you're comparing free nights, free weekends or other time-of-use plans.
Last winter's usage is the best starting point you have, but weather changes from year to year. If you have 24 months of data, price plans on both winters and plan around the colder one.
Smart Meter Texas turns plan shopping from a guess at 1,000 kWh into simple arithmetic on your own home. Download 12 to 24 months, price each EFL month by month with delivery included, and run the 12-3-1 Usage Check before you sign. In the example here, that check flipped the winner: the plan that looked 4.5 cents cheaper cost $91.45 more over a year.
When you're ready to compare, start with Ambit Energy's Texas electricity rates and plans and price each plan's EFL the same way.
Delivery rates in this article come from the PUCT residential TDU table as of November 1, 2026. Plan A, Plan B and the example home's usage are hypothetical, built to show the math, and are not offers. Plan details and rates subject to change, and an Electricity Facts Label is available for every plan.







Copyright © 2026 VIPEnergyService.com. All rights reserved | PUCT# 10117
Important message regarding earnings: Ambit Energy makes no guarantee or promise of income or business. Anyone considering building a full-time or part-time Ambit business should have realistic expectations of their potential income. Learn more at goambit.com/disclaimer.